
Fire scars seen from space: UVT introduces a new service on EOCube.ro
West University of Timișoara introduces “Burn scars”, an experimental service developed through the ROCS project and available on EOCube.ro. It uses satellite images and artificial intelligence to identify areas where vegetation may have been affected by fire. The results can be explored on a publicly accessible map.
Long after a fire has been extinguished, its traces can remain in the landscape. Locating affected areas is a starting point for understanding environmental impacts and deciding where further investigation on the ground is needed. Satellite images offer a view of these changes, including in places that are difficult to reach.
The new service turns these observations into information that is easier to explore and compare. It contributes to ROCS’s aim of making space-based data more accessible to researchers, institutions and the public.
An example from the Reșița area
The summer 2026 fire near Câlnic, Reșița, illustrates what these images can reveal. The comparison below uses an observation from 29 July, before the fire, and another from 8 August. Drag the slider to explore the change or reveal the outline produced by the analysis. You can also add the European EFFIS boundary for comparison.
Reșița / Câlnic: from image to outline
The same satellite crop on two dates. Explore the change and see how the model outlines the area.
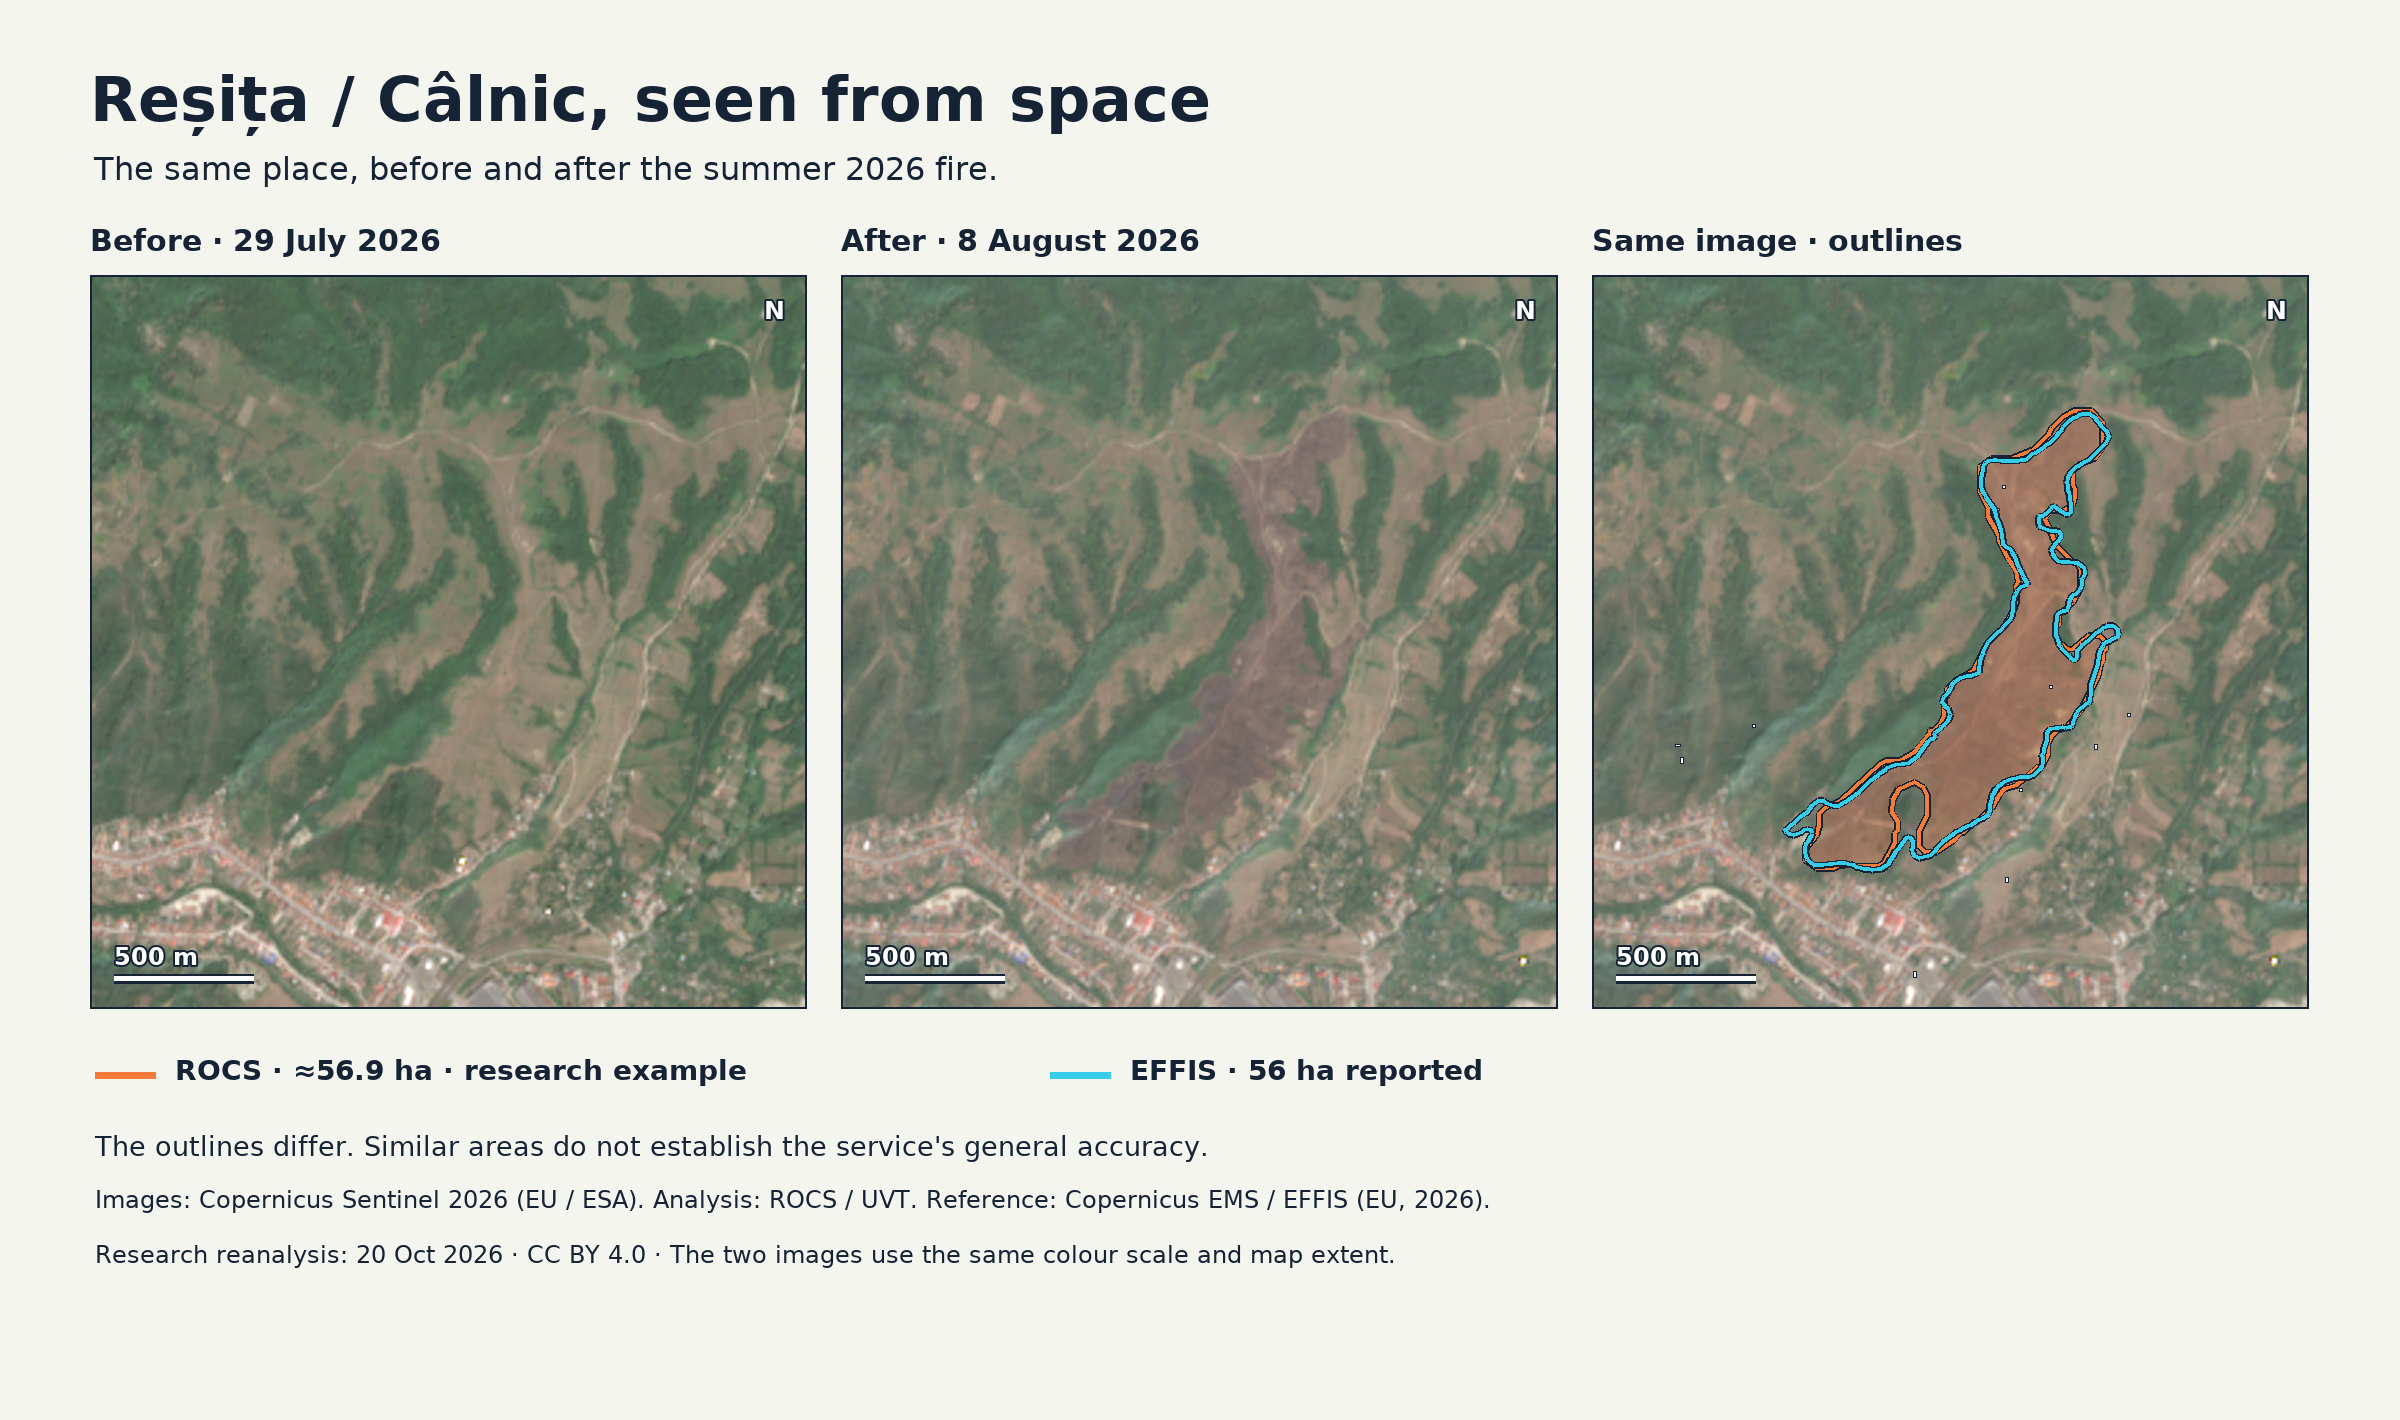
Static comparison; the interactive version requires JavaScript.
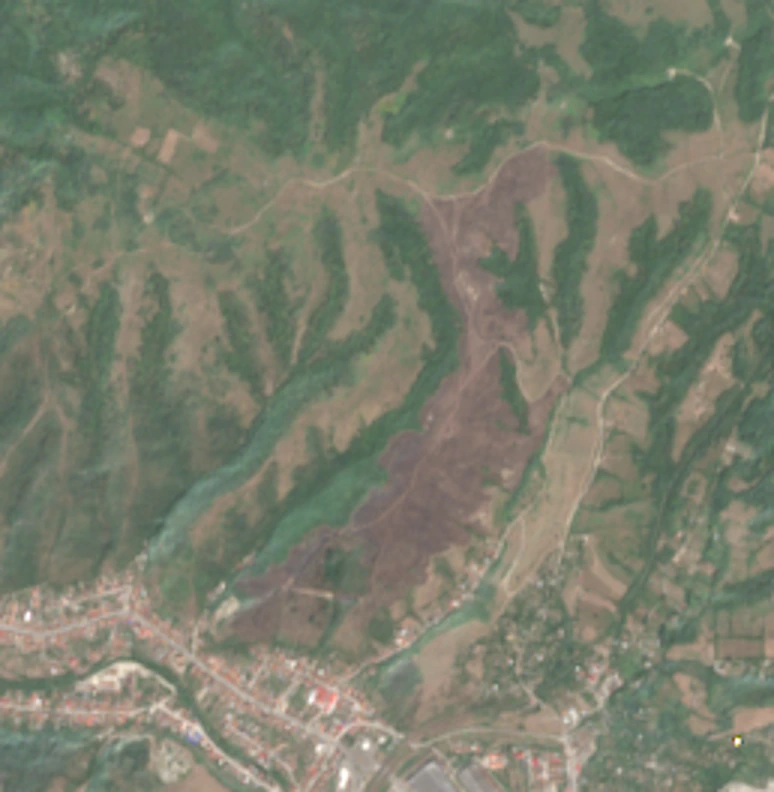
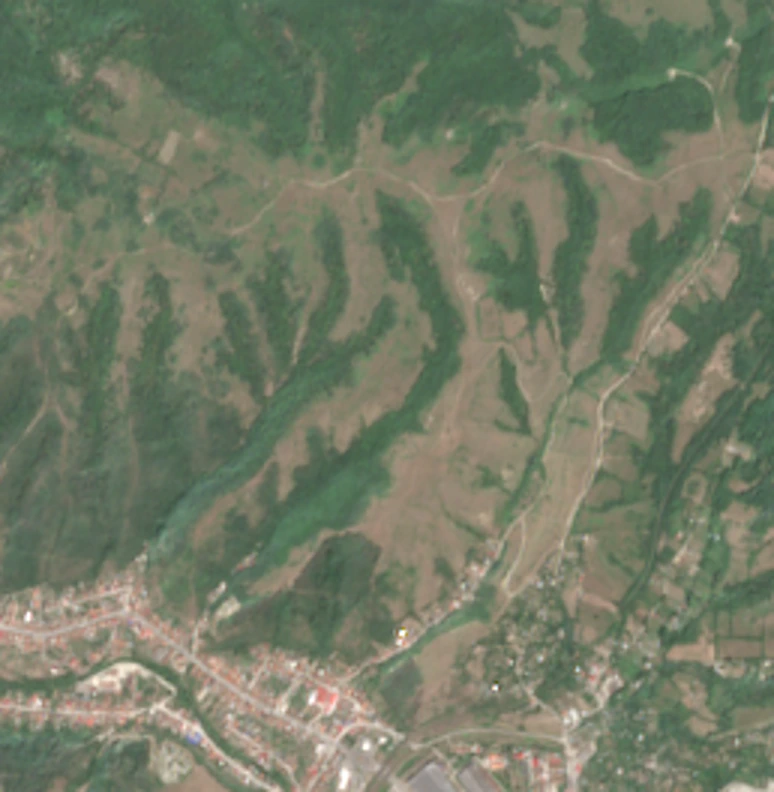
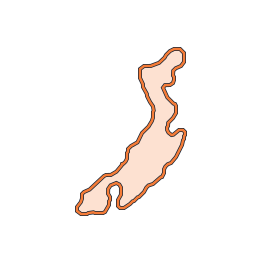
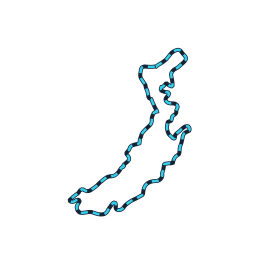

- ROCS · research reanalysis
- Copernicus EMS / EFFIS · reference
Research example for the late-July 2026 fire near Câlnic, Reșița. The ROCS outline comes from the 20 October 2026 reanalysis, not an official damage assessment.
The analysis outlines about 56.9 ha; EFFIS reports 56 ha for this case. The outlines differ, and similar area totals do not establish the service's general accuracy.
About the images and sources
These are real Sentinel-2 observations from 29 July and 8 August 2026, not AI-generated images. Both use the same crop, orientation and colour scale. The interaction reveals previously analysed data; it does not run a new detection or represent a real-time feed.
Copernicus Sentinel 2026 · European Union / ESA. ROCS / UVT · CC BY 4.0. Reference: Copernicus EMS / EFFIS 601503 · © European Union (2026), CC BY 4.0; outline reprojected for display.
Illustration data and provenance · EFFIS licence · AGERPRES report about the fire
From satellite images to a map of possible fire scars
The service compares observations made at different times by Europe’s Sentinel-1 and Sentinel-2 satellites, part of the Copernicus programme. These images show how the land surface changes, while artificial intelligence helps identify areas that may have the characteristics of burned land.
The analysis looks for changes between images rather than flames from an active fire. An initial detection can be revisited when suitable later observations become available. Early results therefore provide a starting point for verification, and new information can help improve their interpretation.
Each result retains information about the images used and the areas analysed. Published data also include information about observation quality and land cover, helping explain why some results need further checking.
A resource for research and public information
The map allows users to locate detections, see their estimated area and compare available images from different dates. It shows results for analysed areas in Romania and neighbouring regions. No account is needed to view the map.
For researchers and students, the service provides material for studying landscape changes and assessing methods of analysis. For institutions, environmental organisations and land managers, it can offer starting points for further investigation and documentation. Journalists and members of the public can explore the geographical context of potentially affected areas and inspect the images behind the results.
This information is most useful when considered alongside observations on the ground and other independent sources. The service is intended to support that work, while leaving the assessment to specialists.
How to read the results
An area marked on the map is an automated indication of a possible fire scar, not official confirmation of a fire. Clouds, incomplete images and other changes to the land can make interpretation difficult. The displayed figure estimates the size of the area outlined by the analysis and should not automatically be reported as a measure of damage.
The analysis also does not continuously cover every piece of land. A boundary may capture only part of an affected area, and the absence of a marker does not prove that no fire occurred there.
The service is under development and evaluation. It is not an alert system for active fires and does not replace information provided by the responsible authorities.
Explore the service
Open the “Burn scars” map. Choose an area and a date range, then select a detection to inspect its details and the available images.
The service is part of EOCube.ro, the platform developed through the ROCS project, coordinated by West University of Timișoara. ROCS aims to expand Romania’s infrastructure for accessing Earth observation data and using it in research and applications of public interest.